Summer is here and we’re thankful to everyone who took a moment away from their day to attend our most recent event!
On June 17, 2021, we hosted A Tour of Power BI Reports You Can Use Today with the NCDM. In this webinar, we looked at Power BI reports that take Nonprofit Common Data Model (NCDM) data and create user-friendly tables, charts, maps, and graphs which provide powerful insights and can strengthen decision making. We walked through the different working parts of the reports and how they can be useful to different organizational staff members.
We’re excited to share this knowledge packed webinar with you. If you missed the event or want a refresher, keep on reading!
The NCDM Community
The webinar opens with Ryan Ozimek, CEO of PICnet, and Tim Lockie, CEO of Now IT Matters, discussing the Nonprofit Common Data Model (NCDM) community, our mission, and our vision.
“We want to join together nonprofit professionals, consultants, SI and ISV partners, all around the world, to find ways that we can spend less time and resources moving data between systems, and helping organizations be more effective and leverage their data to reach their goals.” Ryan Ozimek, CEO of PICnet
Looking at the bigger picture, we want to help reach the United Nations Sustainable Development Goals (SDGs). These goals “provide a shared blueprint for peace and prosperity for people and the planet, now and into the future” (United Nations, Department of Economic and Social Affairs). Poverty, hunger, gender equality, and climate action are just a few of the SDGs that we hope to help conquer by 2030.
“The way we’re looking to do that is by nurturing this community and bringing people together so that we have a way, through the collaboration of businesses, nonprofits, and individuals, to get the hard work done.” Ryan Ozimek, CEO of PICnet
If you want to get involved, join the online community!
Why Business Intelligence?
Having a nonprofit data model is fantastic. Knowing how to budget data in that data model is even better. So, why do organizations need business intelligence? There are four key reasons:
- See the full picture.
Organizations are often focused on specific data points and don’t get the opportunity to see long-term trends.
- Bring details to life.
Spreadsheets are fantastic, but they don’t help organizations tell a story. Business intelligence takes raw data and makes it easily communicable.
- Make decisions from data.
Organizations should be able to see their data AND use it to make smarter decisions and change course when necessary.
- Share insights.
Data, no matter how extensive, isn’t helpful when it exists in a vacuum. Business intelligence makes it easy to share data with team members, staff, and stakeholders.
Power BI
What is Power BI? It’s a powerful reporting and dashboarding tool that allows organizations to visualize their data, make smart decisions from their data, and share their data. Microsoft has a few different Power BI offerings which can be viewed on their website.
Power BI Desktop
This is the creator’s tool. With Power BI Desktop, people can build reports and dashboards pulling data from different sources. This does require a Windows machine, but provides a ton of power packed features.
Power BI Pro
This is the online, web-based service. Power BI Pro includes all the features of Power BI Desktop plus 360-degree real-time views, auto updates, data collaboration, data access governance, and content distribution.
Microsoft's Power BI Report Templates
Microsoft has provided templates for nonprofit organizations to use, out-of-the-box, to get up and running with Power BI. These reports focus on case management, resource management, and outcome surveys. They can be downloaded for free here under “Power BI resources for nonprofits”.

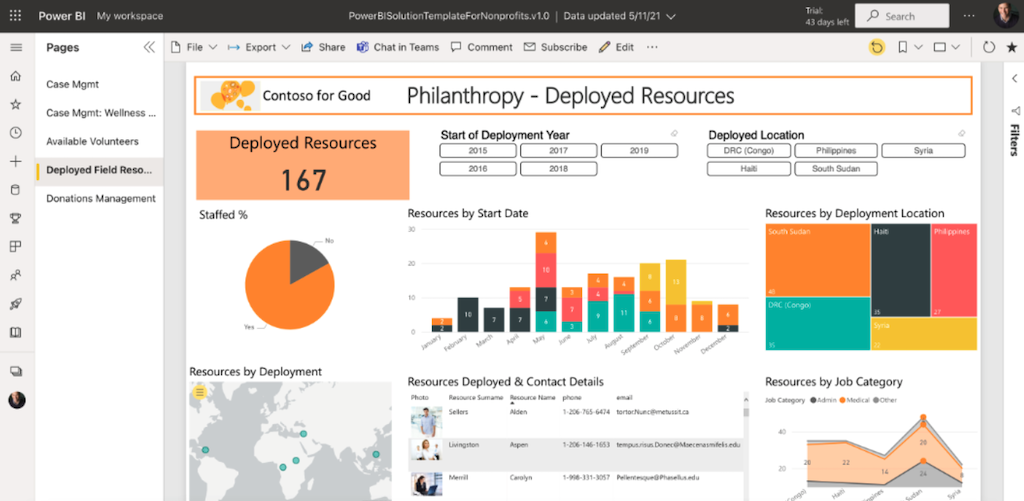
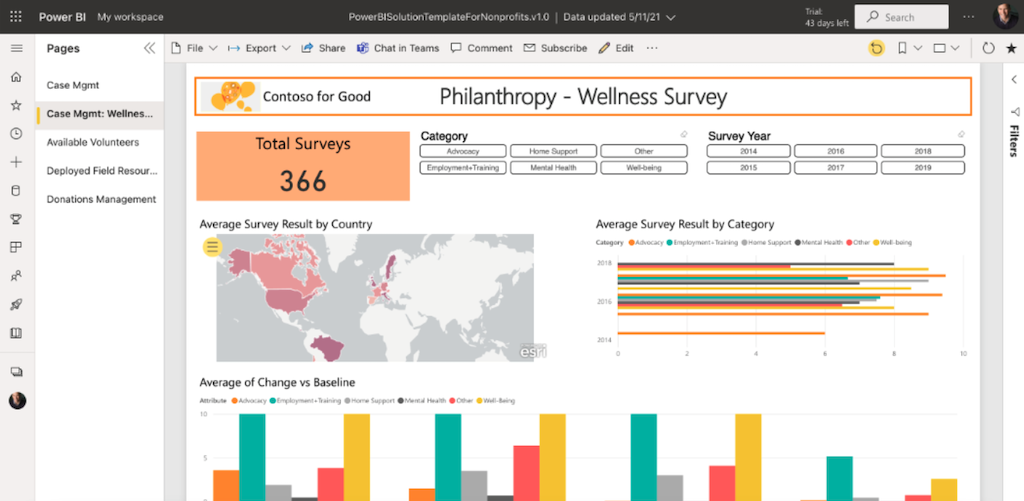
On these templates, there are a few stand-out functionalities that should be noted:
- With the pushpin widget, users can easily pin items, graphs, and displays from different reports to one dashboard.
- Users can choose to view specific data without having to navigate through endless filter menus.
- Users can copy items from a report and paste them into a word document, email, powerpoint, etc. for easy sharing.
Wipfli's Power BI Report Templates
Another company that has created Power BI templates for the nonprofit community is Wipfli. “With more than 84,000 clients and 2,400 associates, Wipfli ranks among the top 20 accounting and business consulting firms in the nation” (Wipfli). While they support a lot of different industries, one of Wipfli’s main focuses is the nonprofit sector. We were super excited to be joined by Andy Potasek, Nina Kortas, and Ryan Risley from the Wipfli team.
“We spent a lot of time in the volunteer management space working with organizations that manage volunteer networks. There’s a lot of angles on a lot of data within volunteer management. From understanding the skills, needs, and interests of volunteers to then aligning that to the needs of the organization. As we looked at the commonalities, we honed in on two avenues, volunteer availability and volunteer participation and engagement.” Andy Potasek, Principle at Wipfli

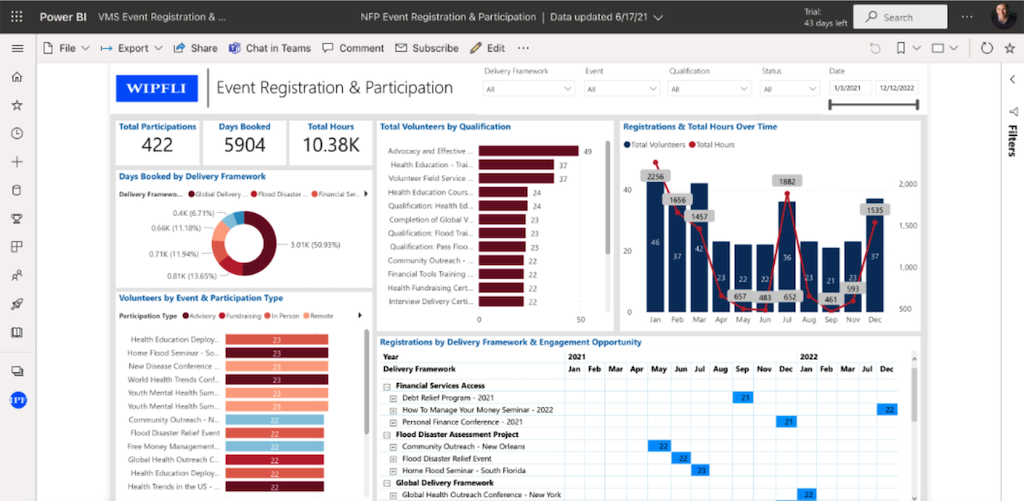
From a volunteer availability perspective, there are 3 main factors that makeup an opportunity:
- Location: How close is the volunteer to the opportunity?
- Availability: Is the volunteer free during the time of the opportunity?
- Skillset: Does the volunteer’s skills and interests match the opportunity?
“The intent of this use-case was to provide one place (to view the above data) as organizations are making decisions about reaching out to a group of volunteers or analyzing their volunteer network.” Andy Potasek, Principal at Wipfli
As Wipfli was looking to analyze the overall impact of volunteer organizations, they created a separate lens with the event registration and participation report. This report can track and analyze volunteer attendance by opportunity, skill, hours, and more, making it easy to communicate and promote program outcomes and metrics. Additionally, this data can be automatically updated up to 8 times a day. These templates are available for free on AppSource.
“The key for us is continuing to evolve, so that the nonprofits in this space don’t have to figure it out all on their own.” Ryan Risley, Principal and CTO at Wipfli
NCDM Community Resources
Nonprofit Power BI templates from MicrosoftAppSource nonprofit apps
Wipfli volunteer templates
A Tour of Power BI Reports You Can Use Today with the NCDM slide deck
Join the NCDM online community
Check out upcoming NCDM community events
Follow us on Twitter
Follow us on LinkedIn
Works Cited
“The 17 Goals.” United Nations, Department of Economic and Social Affairs, https://sdgs.un.org/goals. Accessed 24 June 2021.
“Abous Us.” Wipfli, https://www.wipfli.com/about-wipfli/about-us. Accessed 24 June 2021.
